library(SpectralUnmix)
demo <- coelho_demo_spectra()Getting Started
Load the bundled spectra
The bundled Coelho demo provides four normalized stellar spectra on a common wavelength grid. It is the simplest fully reproducible entry point for the package.
dim(demo$matrix)[1] 4 2250demo$metadata id file teff logg feh
1 cool_giant t03000_g-0.5_p00p00_sed.fits 3000 -0.5 0.0
2 solar_dwarf t05750_g+4.5_p00p04_sed.fits 5750 4.5 0.0
3 a_star t09000_g+4.5_p00p00_sed.fits 9000 4.5 0.0
4 hot_star t18000_g+4.5_p02p00_sed.fits 18000 4.5 0.2Fit the model
fit <- spectral_unmix(
  demo$matrix,
  k = 4,
  lambda_smooth = 0,
  niter = 400,
  lr = 0.03
)
Inspect the result
print(fit)
summary(fit)
basis(fit)
coef(fit)
fit$niter_run
fit$converged
Plot the spectra
plot(fit, type = "spectra", wavelength = demo$wavelength)
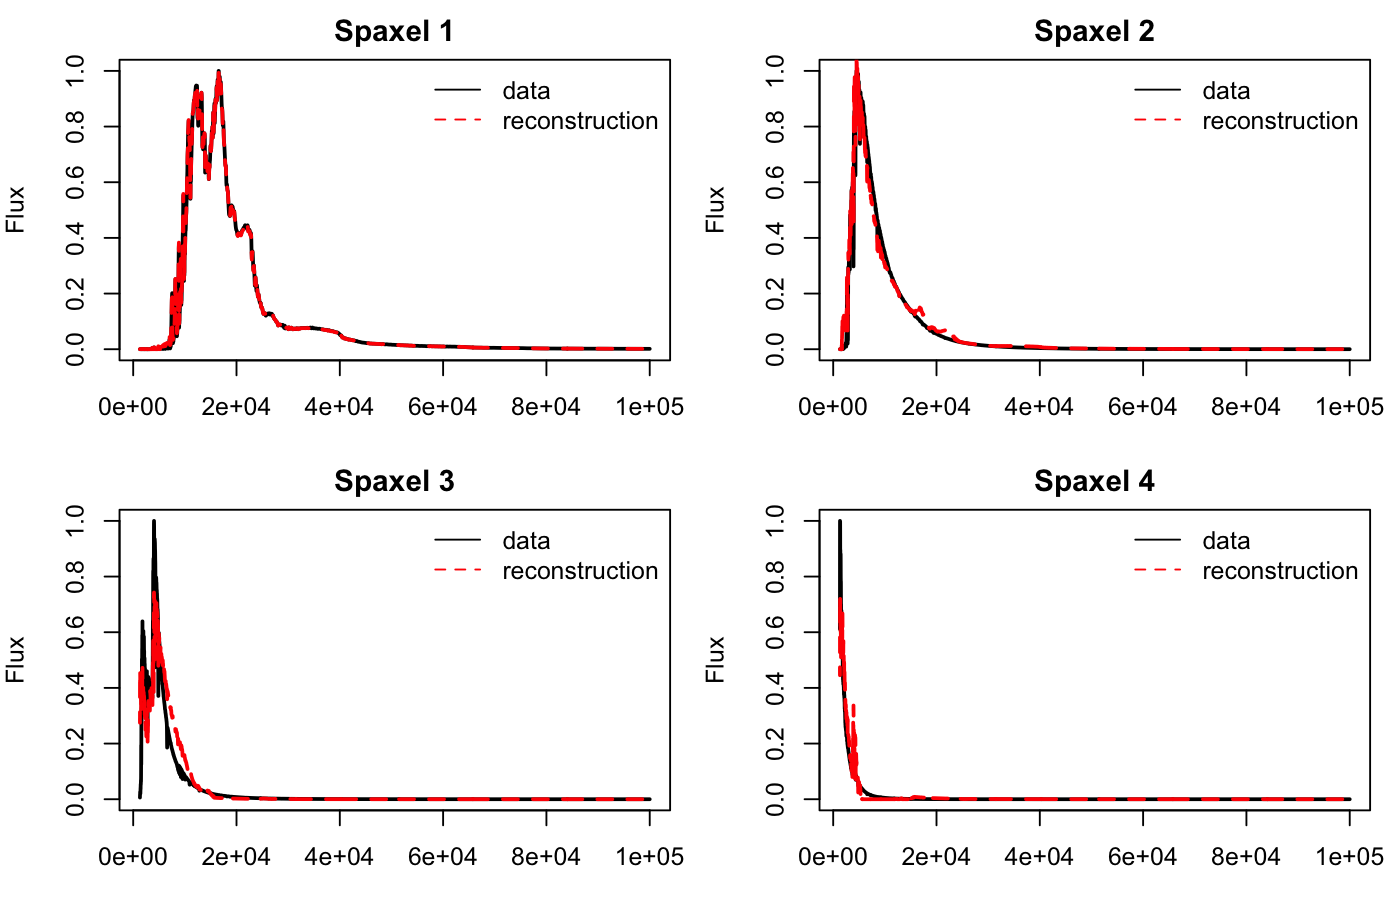
plot_reconstruction(
fit,
demo$matrix,
wavelength = demo$wavelength
)Recovered-versus-observed view for the bundled Coelho sample:
What the outputs mean
fit$spectracontains the recovered component spectra.basis(fit)returns those components as wavelength-by-component columns.fit$reconstructionis the model approximationA %*% S.fit$lossstores the optimization history.fit$niter_runreports how many optimization steps were actually used.fit$convergedreports whether early stopping triggered beforeniter.
Larger library subset
For a denser stellar-library example, use the curated Coelho subset bundled with the package.
stellar_lib <- coelho_stellar_subset()
dim(stellar_lib$matrix)
[1] 100 2250table(stellar_lib$metadata$type)
  a_f_star cool_dwarf cool_giant   hot_star solar_like
        20         20         20         20         20
fit_lib <- spectral_unmix(
stellar_lib$matrix,
k = 5,
lambda_smooth = 0.001,
niter = 500,
lr = 0.03
)
plot(fit_lib, type = "spectra", wavelength = stellar_lib$wavelength)IFU note
The package still supports cube workflows through cube_to_matrix(), matrix_to_cube(), predict(type = "cube"), and component_map(). Those helpers are kept in the API, but the website examples stay focused on the bundled Coelho data so the documentation remains short and reproducible.